
1
Please refer to important disclosures at the end of this report
1
1
Burger King India is one of the fastest growing international QSR chains in India
during the first five years of their operations based on the number of restaurants.
(Source: Technopak). As the national master franchisee of the BURGER KING®
brand in India, the company has exclusive rights to develop, establish, operate
and franchise Burger King branded restaurants in India.
Positives: (1) Exclusive national master franchise rights in India with favorable
royalty fees (capped at 5% of sales) (2) Brand positioned for large and growing
population in India - The Millennials (3) Vertically managed and scalable supply
chain (4) India tailored menu with focus on value leadership (5) Well defined and
standardized processes.
Investment concerns: (1) The outbreak of Covid-19 had a substantial impact on
the restaurant operations (2) The termination of the master franchise and
development agreement would have a material adverse effect on the business
(3) Demand for the products may decrease due to changes in consumer
preferences and food habits.
Outlook & Valuation: In the last ~6 years of operations in India, the company has
opened 268 stores. Looking at the run rate, we believe management will be able
to achieve the target of 700 stores by Dec’26. As the store count will increase,
operating leverage will kick in and the company will be able to report profit. We
believe there is ample scope available for the company to increase its business in
India. On FY20 basis, company peers such as Jubilant FoodWorks (Domino’s
Pizza) and Westlife Development (McDonald) are trading at 8.6x and 5.0x
respectively on EV/sales multiple. At the upper end of the price band, the
company will trade at an EV/sales multiple of 2.2x on FY20 basis, which we
believe is quite reasonable. We believe that there is a good possibility of listing
gains given lower valuations as compared to other listed peers. We are also
positive on the long term growth prospects of the Industry and the company, and
hence recommend to “Subscribe” to the issue for long term as well as for listing
gains.
Key Financials
Y/E March (` cr)
FY18
FY19
FY20
Net Sales
378.1
632.7
841.2
% chg
-
67.3
33.0
Net Profit
-82.2
-38.3
-76.6
% chg
-
53.4
-100.0
EBITDA (%)
2.1
12.5
12.4
EPS (Rs)
(3.1)
(1.4)
(2.8)
P/BV (x)
2.1
2.4
2.2
RoCE (%)
NA
2.3
NA
EV/EBITDA
184.7
20.7
17.5
EV/Sales
4.0
2.6
2.2
Source: Company, Angel Research (Valuation done at the upper price band)
SUBSCRIBE
Issue Open: December 02, 2020
Issue Close: December 04, 2020
QIBs 75% of issue
Non-Institutional 15% of issue
Retail 10% of issue
Promoters 94%
Others
60%
Fresh issue: `450 cr
Present Eq. Paid up Capital: `306.7cr
Offer for Sale: 6 cr Shares
Post Issue Shareholding Pattern
Post Eq. Paid up Capital: `381.7 cr
Issue size (amt): *`804-**`810cr
Price Band: `59-60
Post-issue implied mkt. cap: **`2,290cr
Promoters holding Pre-Issue: 94.3%
Promoters holding Post-Issue: 60.1%
*Calculated on lower price band
** Calculated on upper price band
Book Building
Lot Size: 250 shares and in multiple
thereafter
Keshav Lahoti
+022 39357600, Extn: 6363
keshav.lahoti@angelbroking.com
Burger King India Ltd
IPO Note | Food & Beverage
December 1, 2020
2
Dece
mber
1,
2020
Burger King India | IPO Note
December 1, 2020
2
Company background
Company opened its first restaurant in November 2014, they have used their well
defined restaurant roll out and development process with the aim of growing
quickly, consistently and efficiently into a pan-India QSR chain and capitalizing on
the growing market opportunity in India for QSR restaurants. As at September 30,
2020, the company had 261 restaurants, including eight Sub-Franchised Burger
King Restaurants, across 17 states and union territories and 57 cities across India.
As at the date of this Red Herring Prospectus, the company had 259 company-
owned Burger King Restaurants and nine Sub-Franchised Burger King Restaurants.
Issue Details
Company is raising `450cr through fresh issue and `360cr (at higher price band)
through offer for sale.
Pre & Post IPO Shareholding
No of shares
(Pre-issue)
%
(Post-issue)
%
Promoter
289,311,111
94.3
229,311,111
60.1
Public
17,343,494
5.7
152,343,494
39.9
Total
306,654,605
100.0
381,654,605
100.0
Source: Company, Angel Research (RHP)
Calculated at higher price band
Objects of the offer
Objects of the Fresh Issue `450cr
Particulars
Amt in ` cr
(A) Funding roll out of new outlets
342
(i) Repayment of borrowings
165
(ii) Capital Expenditure
177
(B) General corporate purposes
[ · ]
Total
[ · ]
Source: Company, Angel Research (RHP)
Market share by outlet count
Source: Technopak Research & Analysis
Market share by revenue
Source: Technopak Research & Analysis
56%
8%
7%
6%
4%
19%
Market share by outlet count
Domino's
Subway
McDonald's
KFC
Burger King
Others
48%
6%
11%
10%
5%
21%
Market share by Revenue
Domino's
Subway
McDonald's
KFC
Burger King
Others
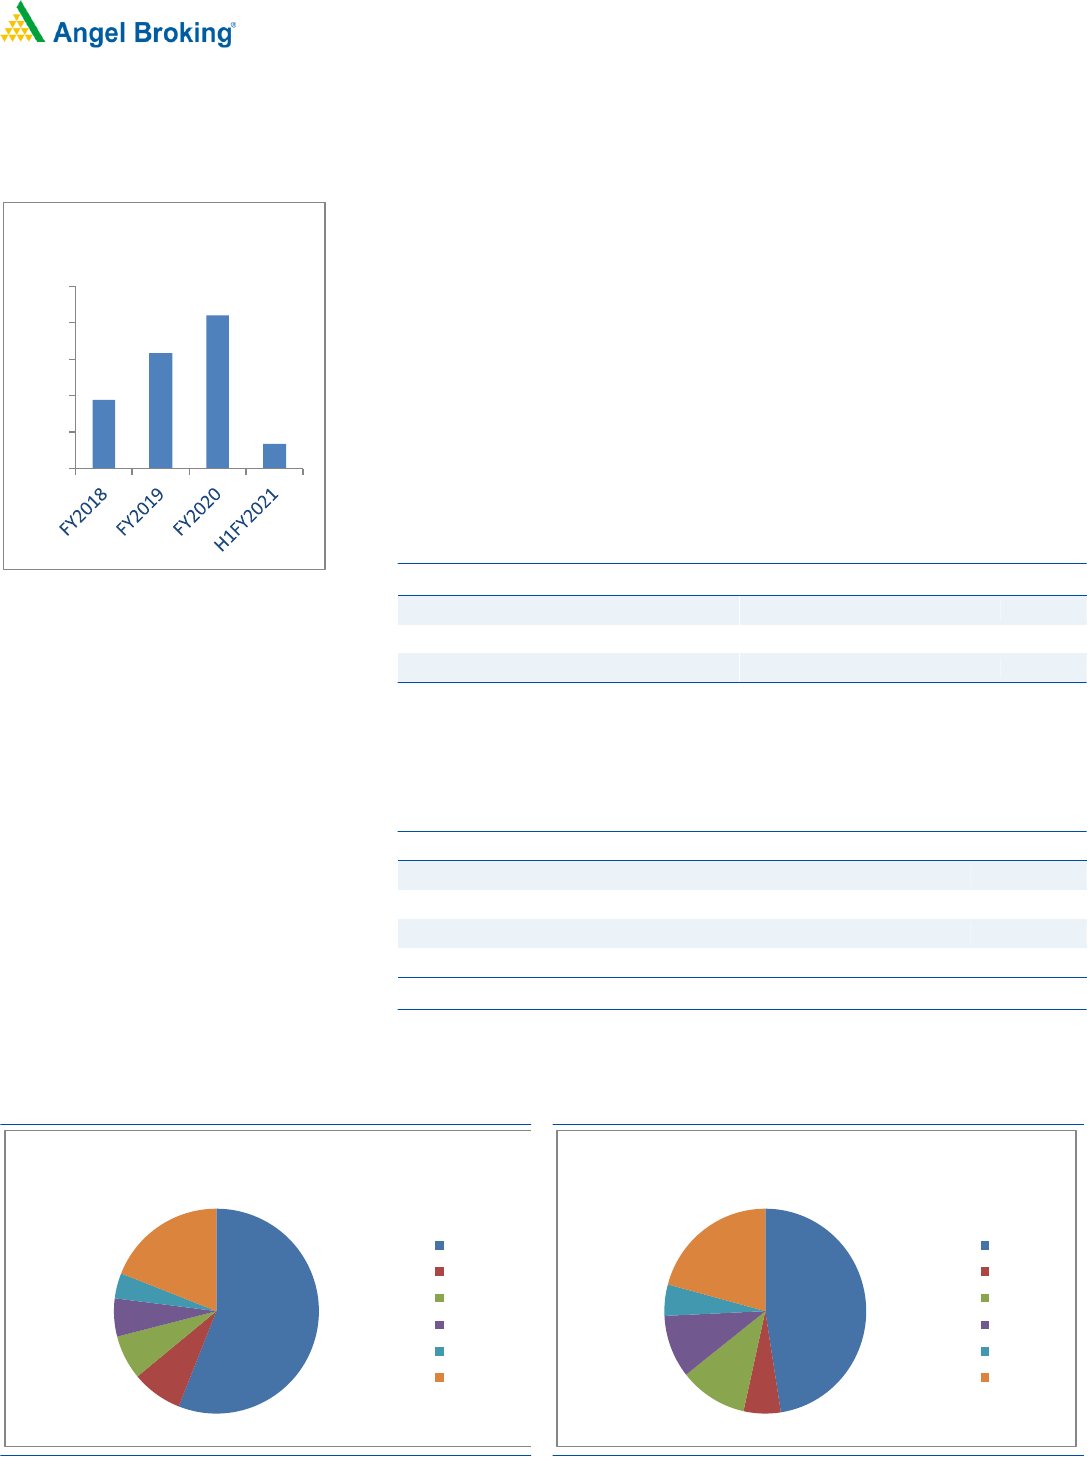
Strong revenue growth
Source: Company, Angel Research
378
633
841
135
0
200
400
600
800
1000
Revenue (` cr)
3
Dece
mber
1,
2020
Burger King India | IPO Note
December 1, 2020
3
Key Management Personnel
Rajeev Varman is the Chief Executive Officer and Whole Time Director of the
company. He was appointed as the Chief Executive Officer and Whole Time
Director of the company on February 27, 2014. He holds a bachelor’s degree in
mechanical engineering from the Bangalore University and a master’s degree of
business administration in marketing from the Golden Gate University. He is
responsible for management and running of business of the company both at
strategic and operational level and overview innovation in the company across all
areas including operations and production. He has over 20 years of work
experience in the food and beverage industry.
Shivakumar Pullaya Dega is Chairman and Independent Director of the company.
He was appointed as an Independent Director of the company on October 14,
2019. He studied at Indian Institute of Technology, Madras. He is also an alumnus
of Indian Institute of Management, Calcutta. He joined the Aditya Birla Group in
January 2018 and is currently serving as the Group Executive President for
corporate strategy and business development of Aditya Birla Management
Corporation Private Limited. He previously served as the Chairman and Chief
Executive Officer (India region) of PepsiCo India Holdings Private Limited and as a
Managing Director of Nokia India Private Limited.
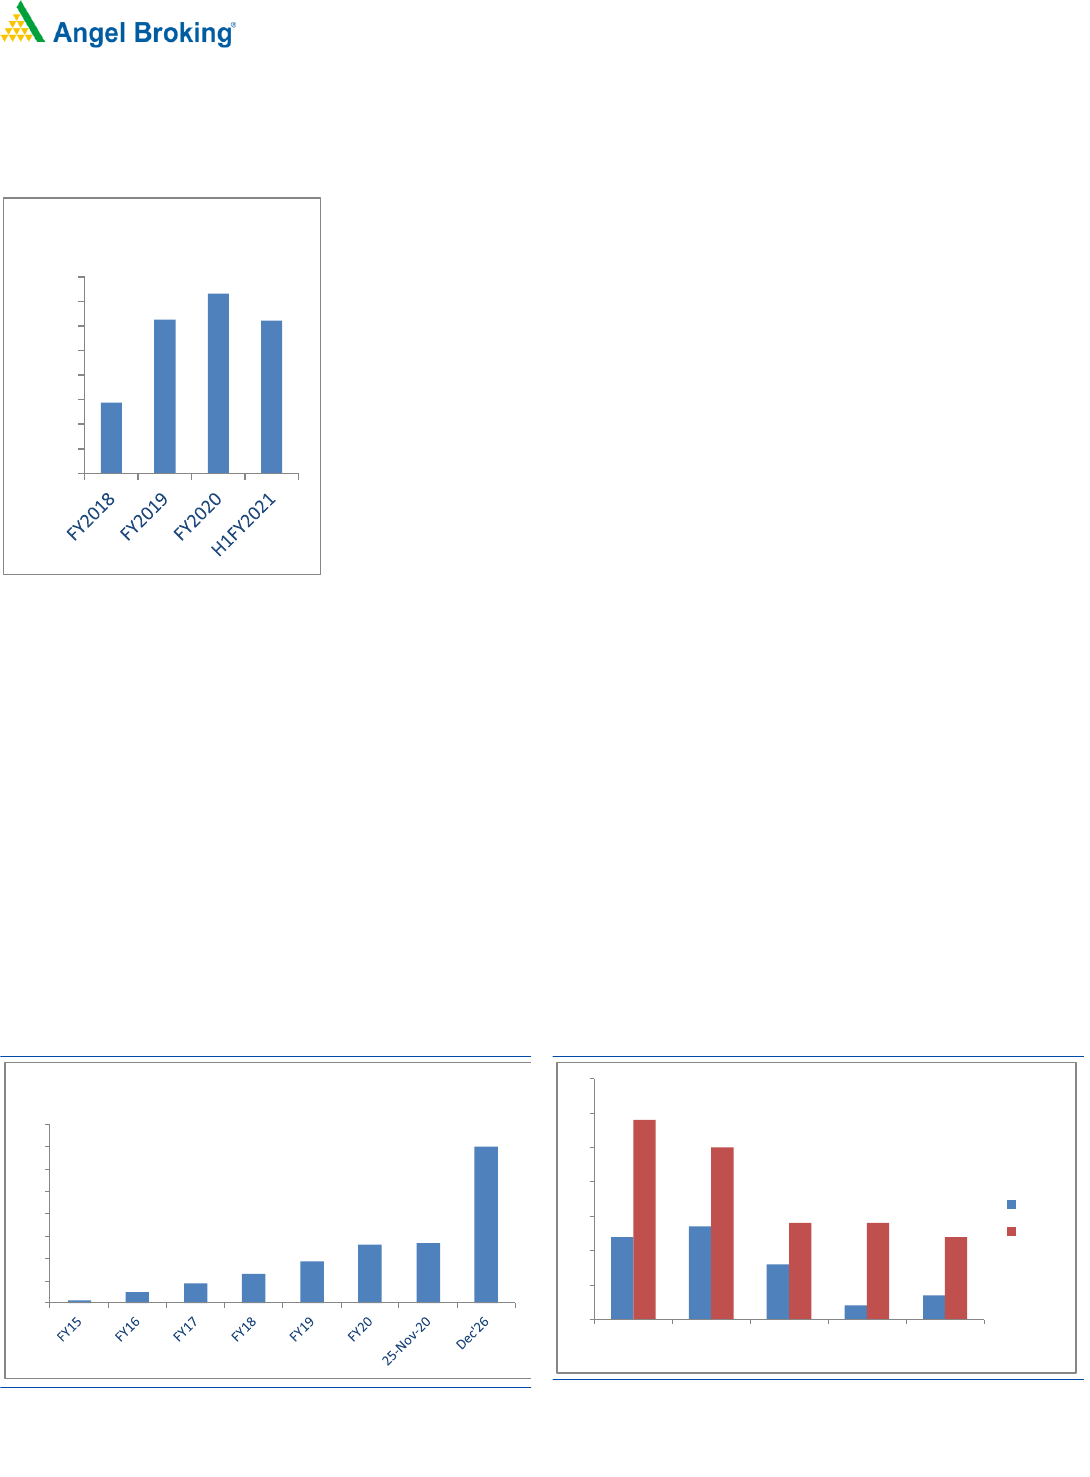
Key Points
Due to Covid-19, currently 249 stores out of 268 stores are operational as of
November 25, 2020. Footfalls and sales are gradually recovering.
Company has raised `58 crore from promoter through a rights issue in
May’20 and `92 crore from Amansa by preferential allotment in Nov’20.
Company has negotiated revised commercial terms with certain service
providers in the changed scenario of Covid-19.
Rapidly expanding stores of the company
Source: Company, Angel Research
Indian Chain QSR sub-segment size in ` billion
Source: Technopak Research & Analysis
Note: Pizza & Indian Ethnic does not include companies operating in CDR
and other segments.
12
49
88
129
187
260
268
700
0
100
200
300
400
500
600
700
800
No of stores
24
27
16
4
7
58
50
28
28
24
0
10
20
30
40
50
60
70
Burgers &
Sandwiches
Pizza
Chicken
Indian Ethnic
Others
FY2015
FY2020
Improving gross margins
Source: Company, Angel Research
61.9%
63.6%
64.2%
63.6%
60.5%
61.0%
61.5%
62.0%
62.5%
63.0%
63.5%
64.0%
64.5%
Gross margins
4
Dece
mber
1,
2020
Burger King India | IPO Note
December 1, 2020
4
Profit & Loss Statement
Y/E March (` cr)
FY18
FY19
FY20
H1FY21
Total operating income
378.1
632.7
841.2
135.2
% chg
-
67.3
33.0
Total Expenditure
370.0
553.8
737.3
163.9
Cost of material consumed
143.9
230.1
301.5
49.2
Employee benefit expense
70.4
96.9
136.6
51.7
Other Expenses
155.7
226.8
299.2
63.0
EBITDA
8.1
78.9
103.9
-28.7
% chg
-
874.1
31.7
(% of Net Sales)
2.1
12.5
12.4
-21.2
Depreciation& Amortisation
64.0
82.2
116.3
62.1
EBIT
-55.9
-3.3
-12.4
-90.8
% chg
-
94.1
- 275.8
(% of Net Sales)
-14.8
-0.5
-1.5
-67.2
Interest & other Charges
36.9
46.4
65.4
42.4
Other Income
10.6
11.4
5.6
16.4
(% of Sales)
2.8
1.8
0.7
12.1
Recurring PBT
-82.2
-38.3
-72.2
-116.8
% chg
-
53.4
-88.5
Exceptional item
-
-
-4.4
-2.1
Tax
-
-
-
-
PAT (reported)
-82.2
-38.3
-76.6
-118.9
% chg
-
53.4
-100.0
(% of Net Sales)
-21.7
-6.1
-9.1
-87.9
Basic & Fully Diluted EPS (Rs)
-3.1
-1.4
-2.8
-
% chg
-
53.4
-90.8
Source: Company, Angel Research

5
Dece
mber
1,
2020
Burger King India | IPO Note
December 1, 2020
5
Balance Sheet
Y/E March (` cr)
FY18
FY19
FY20
H1FY21
SOURCES OF FUNDS
Equity Share Capital
265.0
265.0
277.7
290.9
Other equity
22.1
-15.4
-2.3
-72.1
Shareholders Funds
287.1
249.6
275.4
218.9
Total Loans
-
100.0
198.5
195.8
Other liabities
356.3
456.8
586.1
582.1
Total Liabilities
643.5
806.4
1,060.0
996.7
APPLICATION OF FUNDS
Property, plant & equipment
240.2
347.5
474.2
459.1
Right-of-use Assets
343.3
429.2
538.0
521.7
Capital work-in-progress
10.3
20.2
47.6
41.1
Intangible assets
8.8
15.8
24.5
25.5
Current Assets
109.1
81.5
79.9
96.4
Inventories
5.2
6.9
9.4
8.1
Investments
86.9
38.4
18.6
28.0
Sundry Debtors
2.6
5.9
3.2
6.7
Cash &Bank Balance
7.4
16.0
28.0
33.4
Other Assets
7.0
14.4
20.6
20.2
Current liabilities
86.9
114.0
137.7
180.4
Net Current Assets
22.2
-32.5
-57.8
-84.0
Other Non Current Asset
18.7
26.1
33.5
33.2
Total Assets
643.5
806.4
1060.0
996.7
Source: Company, Angel Research

6
Dece
mber
1,
2020
Burger King India | IPO Note
December 1, 2020
6
Cash Flow Statement
Y/E March (` cr)
FY18
FY19
FY20
H1FY21
Loss before tax
(81.4)
(38.6)
(77.6)
(119.0)
Depreciation
64.0
82.2
116.4
62.1
Change in Working Capital
20.1
6.6
10.8
44.7
Interest Expense
36.9
46.5
65.5
42.4
Direct Tax Paid
(0.4)
(0.2)
(0.2)
0.8
Others
(8.8)
(10.0)
(2.1)
(21.5)
Cash Flow from Operations
30.5
86.5
112.7
9.6
(Inc.)/ Dec. in Fixed Assets
(86.6)
(165.4)
(227.5)
(19.1)
Changes in investment
99.3
51.5
(2.9)
(8.7)
Cash Flow from Investing
12.8
(114.0)
(230.4)
(27.8)
Payment of lease liabilities
(48.4)
(63.9)
(89.5)
(24.8)
Changes in Borrowings
-
-
200.7
0.0
Proceeds from equity shares
-
100.0
-
58.1
Interest paid
-
-
(5.3)
(10.0)
Cash Flow from Financing
(48.4)
36.1
105.9
23.3
Inc./(Dec.) in Cash
(5.2)
8.7
(11.8)
5.1
Opening Cash balances
12.4
7.2
15.9
4.1
Closing Cash balances
7.2
15.9
4.1
9.2
Source: Company, Angel Research
Key Ratios
Y/E March
FY18
FY19
FY20
Valuation Ratio (x)
P/CEPS
NA
36.2
42.0
P/BV
2.1
2.4
2.2
EV/Sales
4.0
2.6
2.2
EV/EBITDA
184.7
20.7
17.5
Per Share Data (Rs)
EPS (Basic)
(3.1)
(1.4)
(2.8)
EPS (fully diluted)
(3.1)
(1.4)
(2.8)
Cash EPS
(0.7)
1.7
1.4
Book Value
28.7
25.0
27.5
Returns (%)
ROCE
NA
2.3
NA
Turnover ratios (x)
Receivables (days)
2.5
3.4
1.4
Inventory (days)
5.0
4.0
4.1
Payables (days)
45.0
36.8
37.8
Working capital cycle (days)
(37.5)
(29.4)
(32.3)
Source: Company, Angel Research (Valuation done at the upper price band)

7
Dece
mber
1,
2020
Burger King India | IPO Note
December 1, 2020
7
Research Team Tel: 022 - 39357800 E-mail: research@angelbroking.com Website: www.angelbroking.com
DISCLAIMER
Angel Broking Limited (hereinafter referred to as “Angel”) is a registered Member of National Stock Exchange of India Limited, Bombay
Stock Exchange Limited, Metropolitan Stock Exchange Limited, Multi Commodity Exchange of India Ltd and National Commodity &
Derivatives Exchange Ltd It is also registered as a Depository Participant with CDSL and Portfolio Manager and Investment Adviser with
SEBI. It also has registration with AMFI as a Mutual Fund Distributor. Angel Broking Limited is a registered entity with SEBI for Research
Analyst in terms of SEBI (Research Analyst) Regulations, 2014 vide registration number INH000000164. Angel or its associates has not
been debarred/ suspended by SEBI or any other regulatory authority for accessing /dealing in securities Market. Angel or its
associates/analyst has not received any compensation / managed or co-managed public offering of securities of the company covered
by Analyst during the past twelve months.
This document is solely for the personal information of the recipient, and must not be singularly used as the basis of any investment
decision. Nothing in this document should be construed as investment or financial advice. Each recipient of this document should make
such investigations as they deem necessary to arrive at an independent evaluation of an investment in the securities of the companies
referred to in this document (including the merits and risks involved), and should consult their own advisors to determine the merits and
risks of such an investment.
Reports based on technical and derivative analysis center on studying charts of a stock's price movement, outstanding positions and
trading volume, as opposed to focusing on a company's fundamentals and, as such, may not match with a report on a company's
fundamentals. Investors are advised to refer the Fundamental and Technical Research Reports available on our website to evaluate the
contrary view, if any
The information in this document has been printed on the basis of publicly available information, internal data and other reliable
sources believed to be true, but we do not represent that it is accurate or complete and it should not be relied on as such, as this
document is for general guidance only. Angel Broking Limited or any of its affiliates/ group companies shall not be in any way
responsible for any loss or damage that may arise to any person from any inadvertent error in the information contained in this report.
Angel Broking Limited has not independently verified all the information contained within this document. Accordingly, we cannot testify,
nor make any representation or warranty, express or implied, to the accuracy, contents or data contained within this document. While
Angel Broking Limited endeavors to update on a reasonable basis the information discussed in this material, there may be regulatory,
compliance, or other reasons that prevent us from doing so.
This document is being supplied to you solely for your information, and its contents, information or data may not be reproduced,
redistributed or passed on, directly or indirectly.
Neither Angel Broking Limited, nor its directors, employees or affiliates shall be liable for any loss or damage that may arise from or in
connection with the use of this information.
